The line chart below shows serious violent crime levels from 1978 to 2000 in the USA. Serious violent crimes include rape, robbery, aggravated assault and homicide.
Summarise the information by selecting and reporting the main features, and make comparisons where relevant.
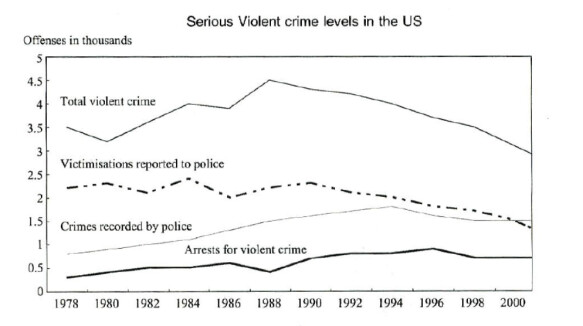
The given chart demonstrates the levels of violent crime in the US in the 22-year period, starting from 1978.
Overall, there was a general downward trend in total crime and victimizations across the whole period in the graph. In contrast, both offenses recorded by police and arrests experienced slight increases. Notably, total crime was higher than other kinds despite decreasing in the half of the period.
Upon analyzing the chart, the figure for total crime was recorded as the highest point, 3,500 offenses, followed by victimizations which was slower, above 2,000 in 1978. In the following decade, total violent crime peaked at 4,500, in the meantime, American crime reported to police saw some fluctuations, between 2,000 and 2,500. From 1989 onward, both of these groups declined gradually, until 2000, there were 3,000 and 1,500 offenses, respectively for total crime and victimizations.
Turning to the remaining groups, they stated just under 1,000 crimes before going up. With a constant rise throughout the given period, American people who committed crimes doubled the initial amount, from about 750 to 1,500; while the arrests figure just showed an insignificant increase, ending up with nearly 500.