topic: the charts below show the results of an international survey carried out in New Zealand in 2004.
my essay:
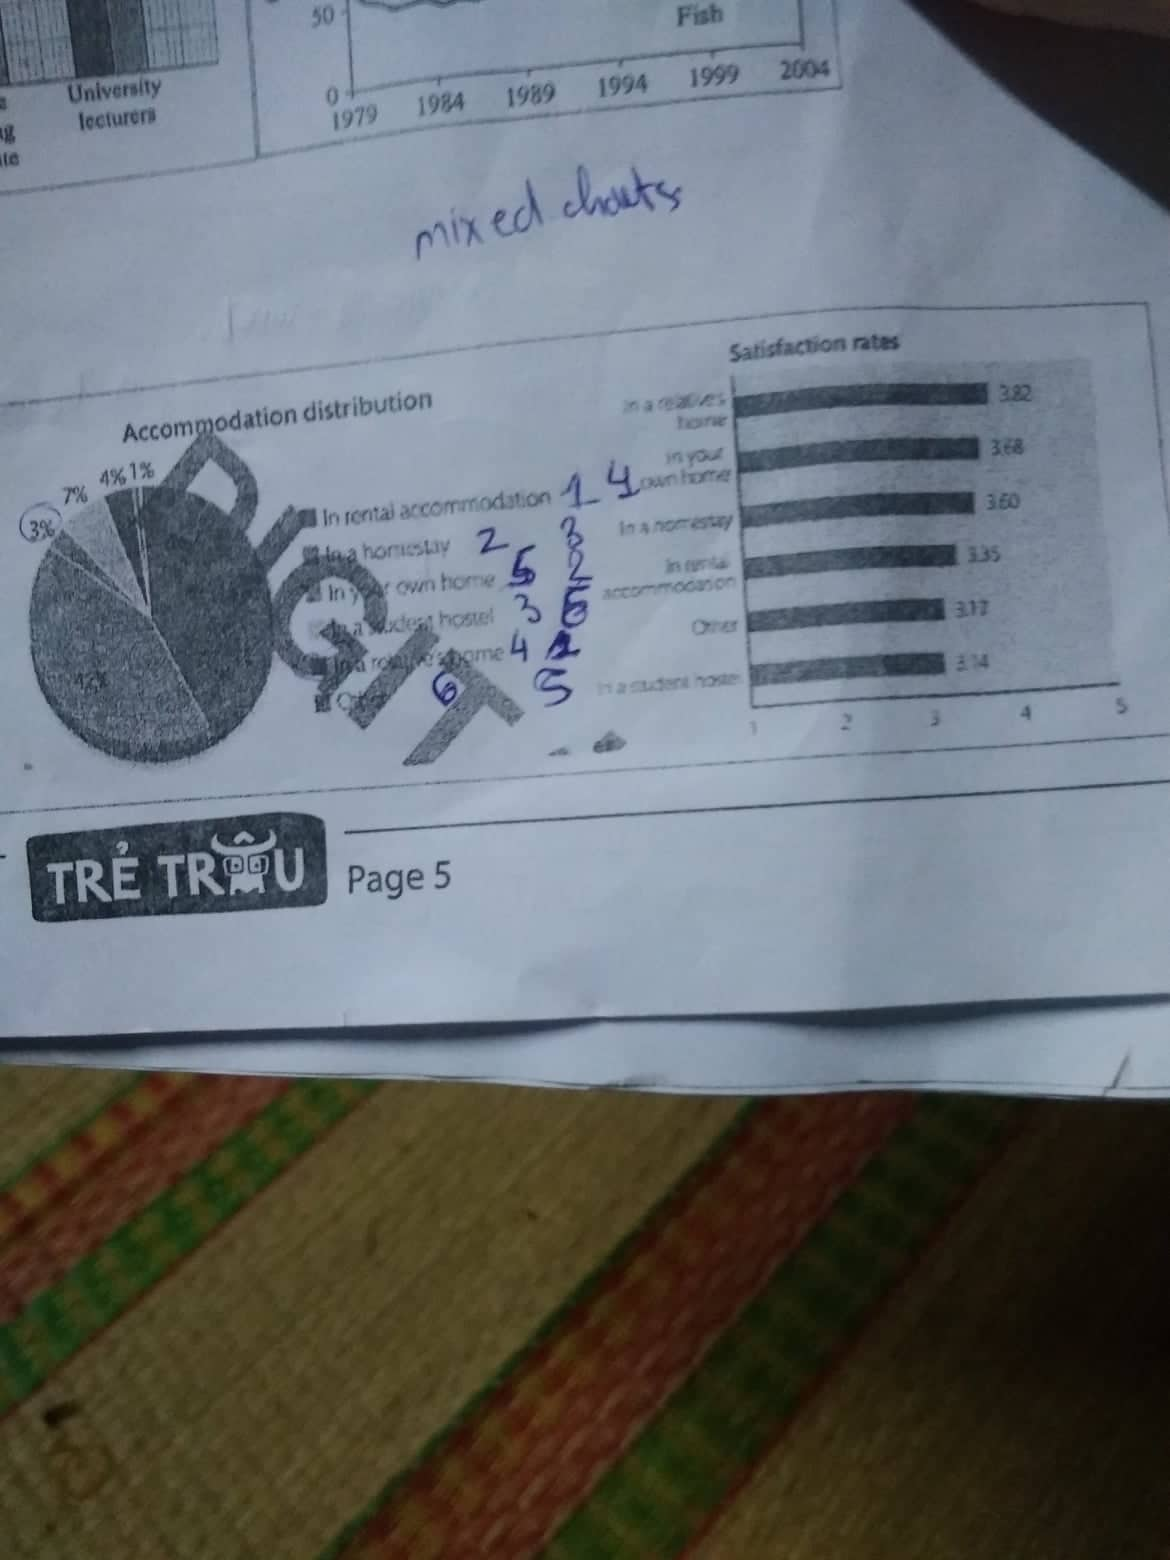
A survey was conducted in 2004 asking international students in New Zealand where they live and how satisfied they were with their accommodations, rating from 1 to 5. The pie chart shows the results for the first question and the horizontal bar chart for the second. The accommodations are grouped into six categories: rented house, homestay, own homes, student hostel/ dormitory, relative homes, and the others.
Overall, nearly all stayed in either a rental habitation or a homestay, and these two are almost equally common. The levels of satisfaction did not vary much over these accommodations, with the relative home getting the highest rate.
In detail, approximately four out of ten students lived in rented houses (43%), ten times more than those picking their relative homes; the less common choice received the highest rate of satisfaction, whereas the other one was the four largest, 3.82 versus 3.35. Compared to rental places, the number of those picking a homestay was similar, 42%, but it made these people feel more pleased, with a rate of 3.6. The student hostel, with the lowest satisfaction rate of 3.14, was the third most common selection for living, with 7% choosing this. The participants all felt satisfied with the place they lived, with the rates staying in a narrow range between 3.14 and 3.62.