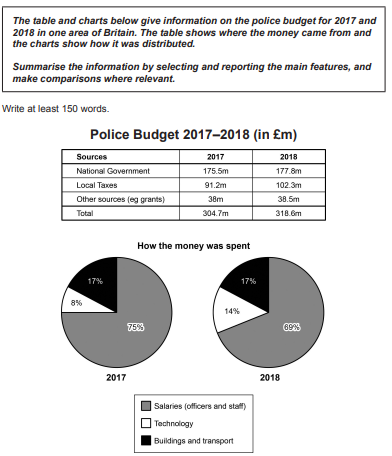
The table displays the funding sources for police forces of a region in the United Kingdom in two years – 2017 and 2018, while the pie charts illustrate the distribution of these amount of money.
We can see clearly on the table that there were two primary sources of fund sponsoring for police, and governmental budget is the major one. The two pie charts show that the wage of officers and employees was accounted for the highest percentage in the total budget expenditure compared to other two expenditures.
The table reveals that governmental budget constituted more than half of total budget, with around 176 and 178 million pound in 2017 and 2018 respectively. The total budget in 2018 was nearly 19 million pound higher than in 2017, which mainly come from an increase in the contribution of local taxes.
The pie charts represented that three fourth of total budget in 2017 was to pay salary while this proportion in 2018 witnessed fell slightly to make room for technology innovation at 14%. Transportation and building maintenance cost remained constant at 17 percent in both observed years.
The table shows the sources of funding for police forces in a region in the UK in two years - 2017 and 2018, while the pie charts illustrate the distribution of these amounts of money.
We can clearly see from the table that there were two main sources of funding for the police, with the government budget being the largest. The two pie charts show that the salaries of officers and employees accounted for the highest percentage of total budget expenditure compared to the other two expenditures.
The table shows that the governmental budget accounted for more than half of the total budget, with approximately £176 million and £178 million in 2017 and 2018 respectively. The total budget in 2018 was almost 19 million pounds higher than in 2017, mainly due to an increase in the contribution of local taxes.
The pie charts showed that in 2017, three quarters of the total budget was used to pay salaries, while in 2018, this proportion decreased slightly to make room for technological innovation at 14%. Transport and building maintenance costs remained constant at 17 per cent in both observed years.