Please help me check my writing, teacher

image
image

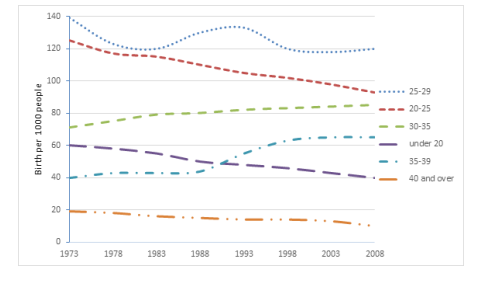
The line graph compares the birth rate in the 1973 to 2008 period by age groups.
Overall, most age groups had their number of births decreased but the birth rate in all groups were still moderately high.
At the start point, the 25-29 years old had the highest births of the graph, at about 140 births but its statistic fluctuted and decreased to nearly 120 births but still stayed as the highest group . In 1973 the 30-35 women’s births were about 70 births per 1000 people, and from 1973 to 1983, its statistic shiftly increased to nearly 80 births, after that period, this group births rate continued to rose but with gradual speed and eventually reached around 84 births peak, stayed. Women who were 35-39 years old had their birth rate remained stable around 40 births peak in the 1973 to 1988 peak but tremendously rose to above 60 births in the remain period and overtook the under 20 group which previously had much higher statistic.
The 20-25 age group was the second highest group in 1973 but its statistic dramatically decreased down do about 90 births in 2008. The under 20 age group experienced the same trend which made them went down from 60 births to approximately 40. The last group is the 40 years old and over, this group had the lowest birth rate in 1973, as it occupied just about 20 births but it then even slightly decreased down to about 15 births in the remain period.

1 Like

The line graph compares the birth rate between 1973 and 2008 by age group.
Overall, the number of births fell in most age groups, but the birth rate was still moderately high in all groups.
At the beginning of the graph, 25-29 year olds had the highest number of births with around 140 births, but their number fluctuated and fell to almost 120 births, but they still remained the highest group. In 1973 the 30-35 year old women’s births were around 70 births per 1000 people, and from 1973 to 1983 its statistic fluctuated and increased to nearly 80 births, after that period this group’s birth rate continued to rise but with gradual speed and finally reached around 84 births peak, staying. Women who were 35-39 years old had their birth rate remained stable around 40 births peak in the 1973 to 1988 peak but rose tremendously to over 60 births in the remain period and overtook the under 20 group which previously had much higher statistic.
The 20-25 age group was the second highest group in 1973, but its statistics fell dramatically to around 90 births in 2008. The under 20s followed the same trend, falling from 60 births to around 40. The last group is the 40+ age group, this group had the lowest birth rate in 1973, as it only accounted for about 20 births, but then it even decreased slightly down to about 15 births in the remaining period.

1 Like