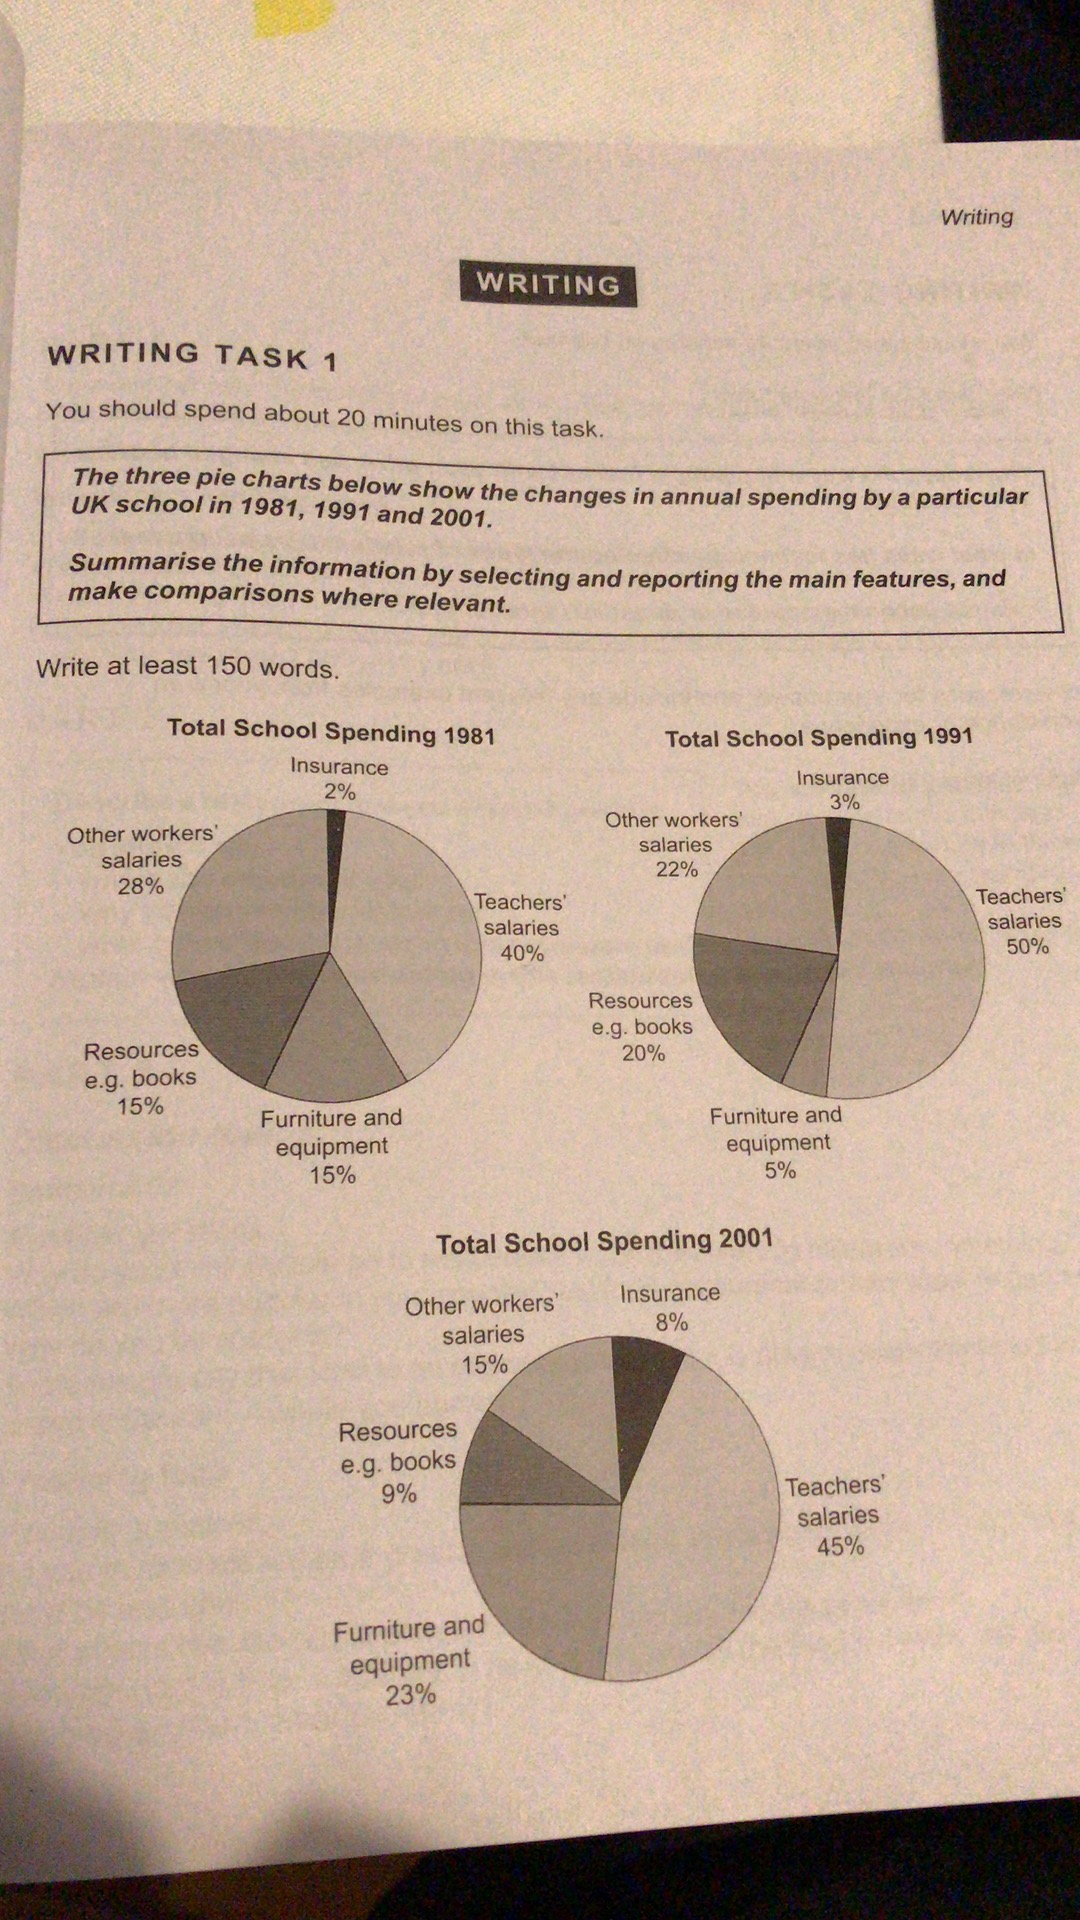
The three pie charts show the changes in annual spending from five aspects, Insurance, teachers’ salaries, furniture and equipment, resources and other workers’ salaries. And these fluctuations happened in a particular UK school separately in 1981,1991 and 2001. So we can see every ten years’ inclination of the school spending are stably increasing on insurance, its proportion of the whole spending was increased by 1% and 5% from the very beginning 2%. And the second attractive data is the declining portion of other workers’ salaries, decreasing by 6% and 7% to a 15%, which is only 1 in 3 of the teachers’ salaries in 2001. Besides, after a boost to 20%, in 2001 resources’ part fell to a poor 9%. On the contrary, after a shrinking ratio to 5% from 15%, in 2001 furniture and equipment accounted for as much as 23%. And it possibly influenced by the highly developed technologies in this age. Finally, the proportion of teachers’ salaries escalated from 40% to 50% in 1991 and later descended to 45%, which is not modified at a large scale as other parts.
Hi Sylvia, I’m afraid your report had some deficiencies. First, you should begin by “reporting the main features”. Here, over the entire 20 year period, insurance increased, other workers’ salaries decreased, and the other line items fluctuated, with the furniture and equipment category experiencing the most radical swings. You have tried to use good description words, but some of them are not used correctly. Also, when you talk about how something changed, if you just give the change, "it went up 10% and then down 5%, it is not as clear as including the time frame as well as the initial and final values. Overall, I think I would rate this one a band 5. Here are some specific suggestions.