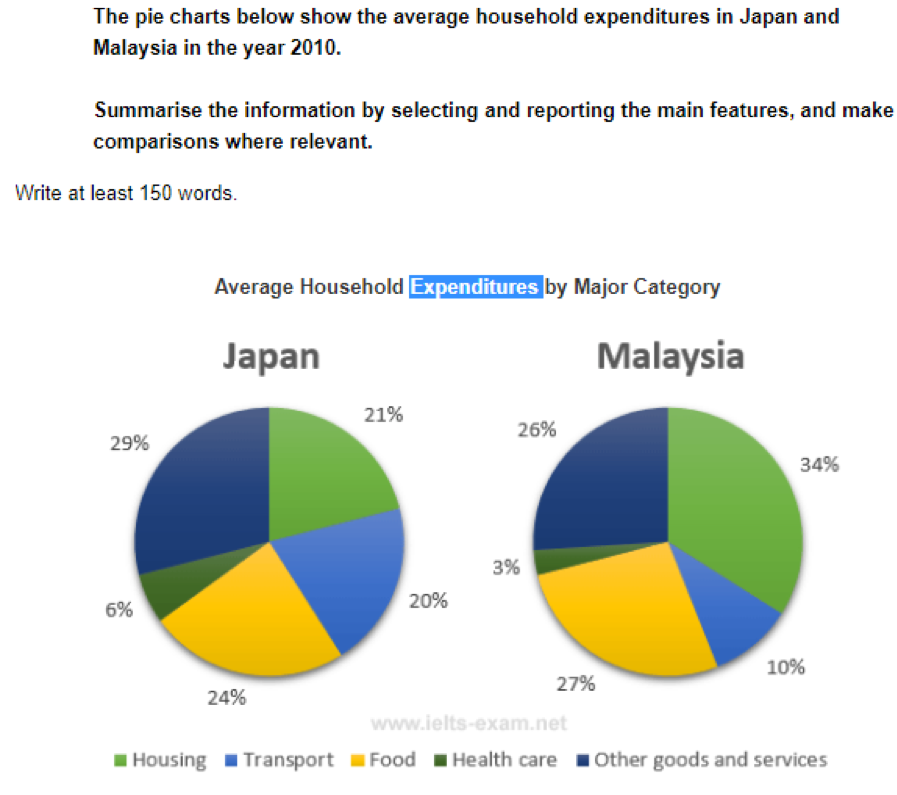
The two given pie charts illustrate the percentage of household expenses on average in Japan and Malaysia in 2010.
Overall, it is clear to indicate that people in Japan had to pay the biggest money for other goods and services while housing was the highest household expenditure in Malaysia.
As for three highest household expenditures in Japan, housing took up 29% of total money, and 24% of money the Japanese spent on food. In addition, the percentage of money used for housing was 21%. As for top three highest household expenses in Malaysia, 34% of their money was paid for housing. Food and other goods and services respectively made up 27% and 26% of total money in 2010.
In terms of other expenditures in Japan, they spent 20% of money on transport and 6% of their money on healthcare. In terms of the rest of household expenses in Malaysia, 10% of their money was paid for transport, and a mere 3% of money used for healthcare.
Hi, I think you reported the main features here, but you almost completely skipped the second half of the prompt - “make comparisons where relevant”.
There are a lot of comparisons that should be made here, both in the summary and in smaller details - health care took up twice as much of households’ budgets in Japan as it did in Malaysia and transportation was also twice as much in Japan.
You repeat “money” a lot, and using money in this context sounds a bit odd anyway.
Use words like spending, expenses, expenditures, budget, household expenses, and so on .
Here are some specific suggestions: