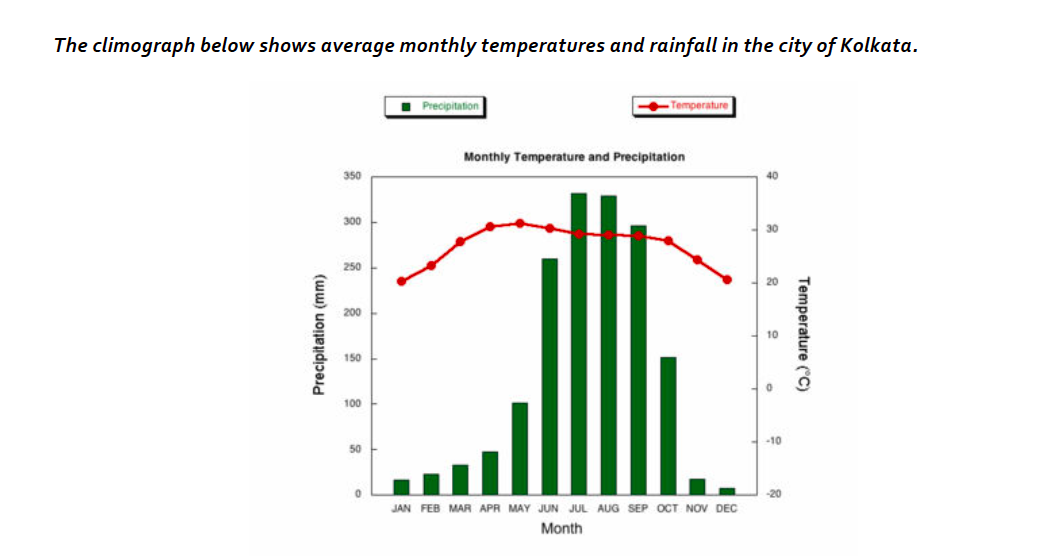
The chart compares average figures for temperature and precipitation over the course of a calendar year in Kolkata.
Overall, it is clear that monthly figures for precipitation in Kolkata change constantly, whereas monthly temperatures remain relatively stable. Rainfall is highest from July to August, while temperatures are highest in April and May.
From January to May, average temperatures rise from the lowest point which is around 20 degree Celsius to a peak of over 30 degree Celcius. Average rainfall in the city also rises through out these 4 months, from nearly 20mm of rain in January to 100mm in May.
Although temperatures stay roughly the same for the next four months, the amount of rainfall is more than double the between May and June. Figures for precipitation remain above 250mm from June to September, peaking at nearly 330mm in July. The final three months experience a dramatic fall in precipitation to 10mm while temperatures witness a slight drop to 20 degree Celcius in December.
Hi, I think your overall summary could have been better. You need to state that there is a clear dry season in winter and a wet/rainy season in summer, with intermediate levels of precipitation in the spring and fall. Your actual specific descriptions of the yearly temperatures and rainfall were better though.
Here are some specific suggestions: