Dear teacher,
Please help me check my friend’s IELTS Writing task 1 report.
Thank you,
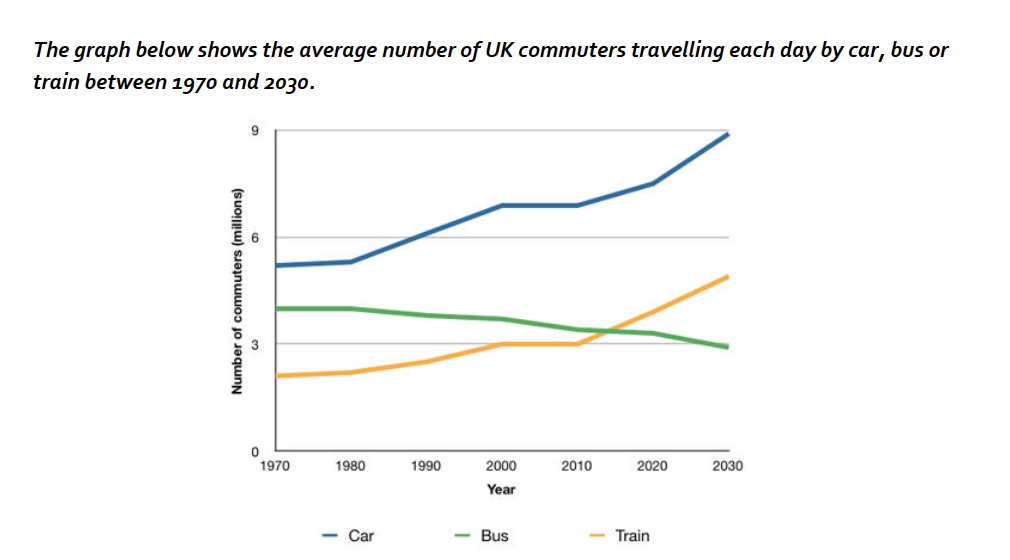
The line graph compares the data on three different types of transport in millions of UK worker daily travel numbers who used car ©, bus (B) and train (T) over the period from 1970 to 2030. Overall, it is clear that car is by far the most popular means of transport for UK traveller over the period, while the figure for car and train users rise slightly, bus commuter numbers is opposite.
At the start of the period, C had the highest commuter numbers among all three transports was around 5 compared with B and T had the lower commuter numbers were approximately 4 and 2 people respectively in the year 1970. In 2000, the figure for those who drove a car to work climbed to 7 and the number of commuting rail passengers rocketed to a high of 3. On the other hand, bus traveller numbers saw a slight drop of o.5 people in 2000.
By 2030, people using car numbers is expected to reach almost 9, and train user numbers also predicted to rise nearly 5 people. In contrast, buses will become the least popular choice, with only 3 daily users.