Dear teacher,
Please help me check my friend’s IELTS writing task 1 report.
Thank you,
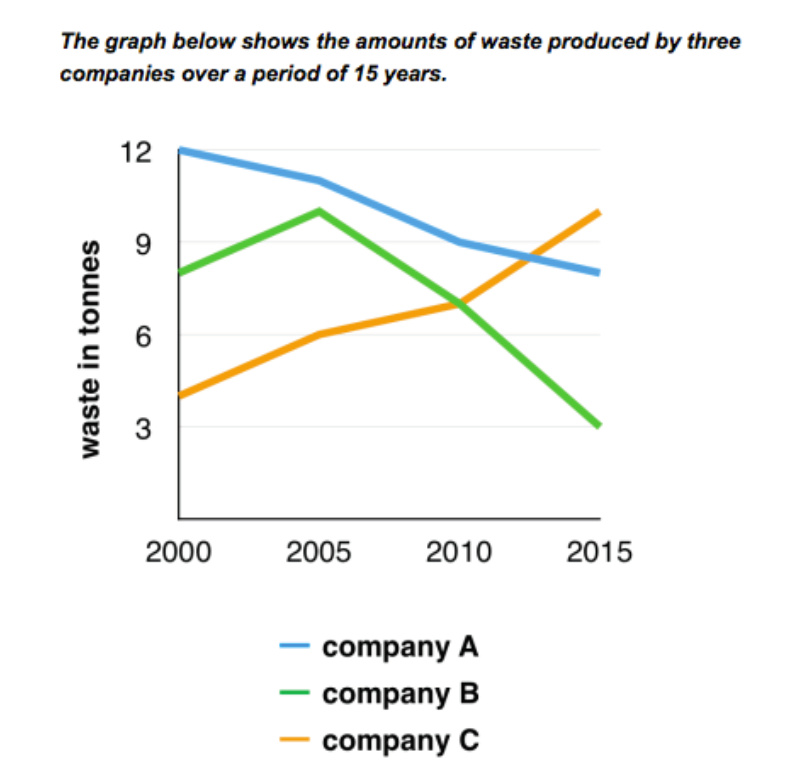
The line graph compares three different companies in terms of the figure waste output during the period between 2000 and 2015.
In general, it is clear that there were different trends in the amount of waste produced in three companies, namely company A (A) ,company B (B) and company C © , with both A and B companies experienced waste produced drop throughout the period but C rose dramatically higher than A and B at the end of the period.
At the beginning of the point, A was the company with the largest amount of waste output with 12 tonnes, whereas B and C companies produced just around 8 and 4 tonnes of waste material respectively in the year 2000. Subsequently, the waste output of B and C moved in the same direction in the following next 5 years, with both companies rose sharply by around 2 tonnes, while the figure for A fell gradually at about 1 tonne.
From 2005 to 2015, A and B reduced waste production by roughly 3 and 7 tonnes respectively. In contrast, C witnessed a steep increased in waste output of approximately 4 tonnes during the same 10-year period, before rocketing to a high of 10 tonnes compared with the respective amount of waste from A and B had plunged to 8 and only 3 tonnes.