Hi guys,
Kindly checking and editing my writing task 1 with many thanks.
The line graph compares the birth rates of China and the USA and how the proportion of birth changed from 1920 to 2000.
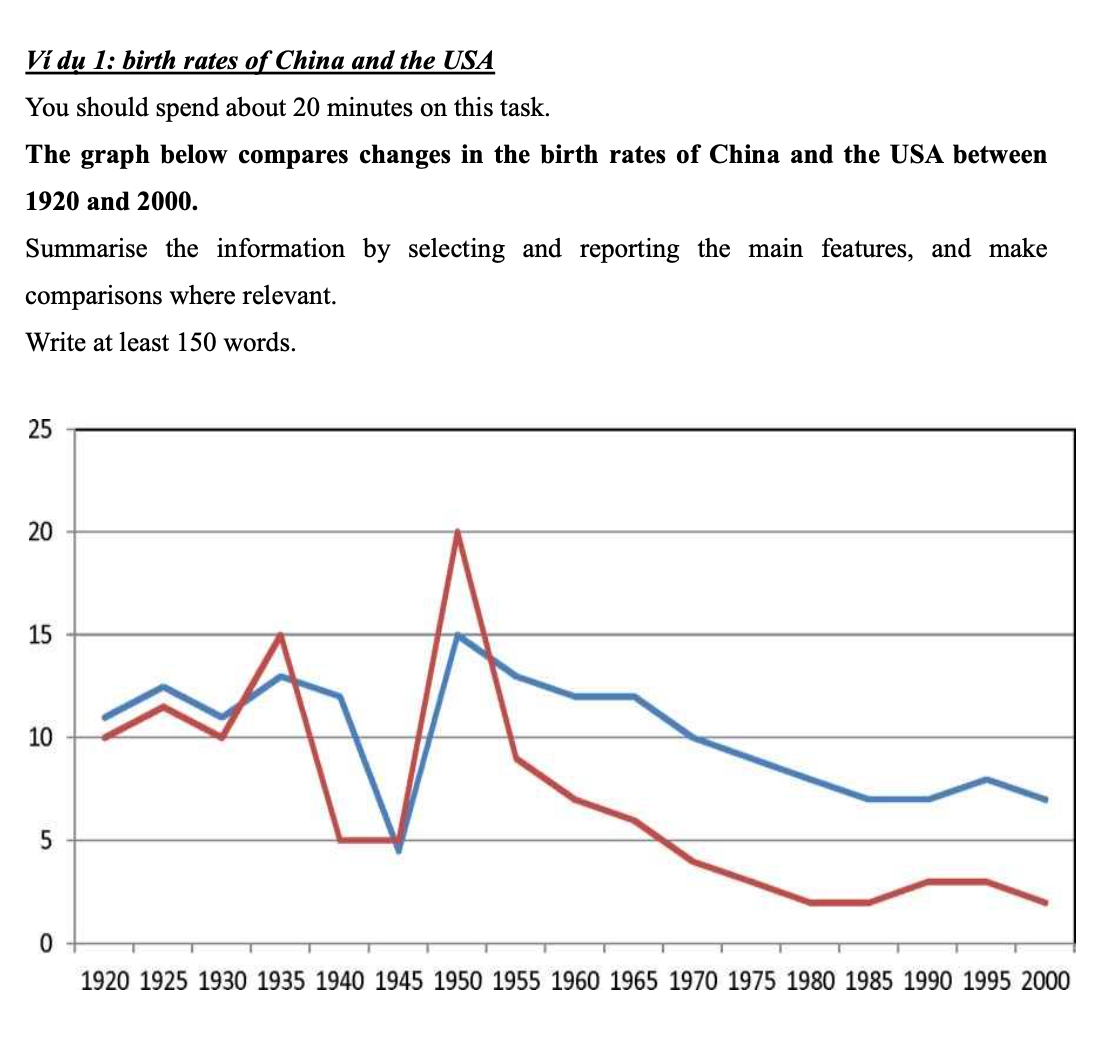
Overall, it is a fluctuation in the birth rates of both countries in period of 80-year starting in 1920. Although the proportion of birth were same downward trend, the USA’s birth rate was still higher than the China in most years except from 1945s to 1950s,
In the period from 1920 to 1935, the proportion of birth in USA rapidly changed and always around 10 percent. But in 1945s, the birth rate dramatically decreased with under 5 percent - this was the least rate in most years. In the period of 5 years starting in 1945, this proportion gradually growth and reached a peak at 15 percent. The birth rate in USA moderately decreased which fell 7 percent by the year 2000.
Nearly the same as birth rate of USA, these of China also approximately 10 percent in 15 years, and 15 percent in 1935s, equal to USA’s highest rate. Likely USA, the rate of birth drop 5 percent in 1940s-1945s and reached the highest rate with 20% in 1950s of the whole line graph. By contrast, after that 5 years, the proportion dramatically decreased and reached the worst point with 2% in 2000.