The charts below show the percentage of water used for different purposes in six areas of the world.
Summarise the information by selecting and reporting the main features, and make comparisons where relevant
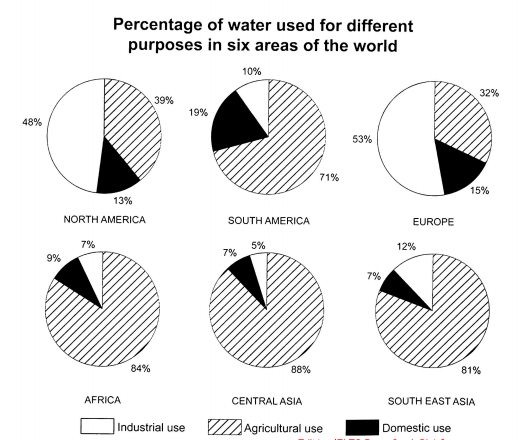
The pie charts illustrate the proportion of water usage for original purposes (industry, agriculture, dome) in six regions across the globe.
Overall, the vast majority of water utilized for agriculture in South America, Africa, Central Asia, and Southeast Asia. By contrast, in North America and Europe water consumed for industry accounts for the highest percentage.
Over 80% of the water in Africa, Central Asia, and South-East Asia going to the agricultural sector and South America takes up 71%. However, for the same purpose, two other areas used for the amount of water are less, at 32% and 39% respectively. We can see the opposite trend when looking at water consumption in industrial use. This sector consumes the water in North America and Europe around 48% and 53% respectively, whereas the figures for the others are significantly lower, at about 7%
Turning to the remaining sector, water usage for domestic in Central Asia and South East Asia is the same (7%), while Africa is lightly higher (9%). North America, South America, Europe use over 13%
P/s: Thank all guys for reading and marking for my essay !!!