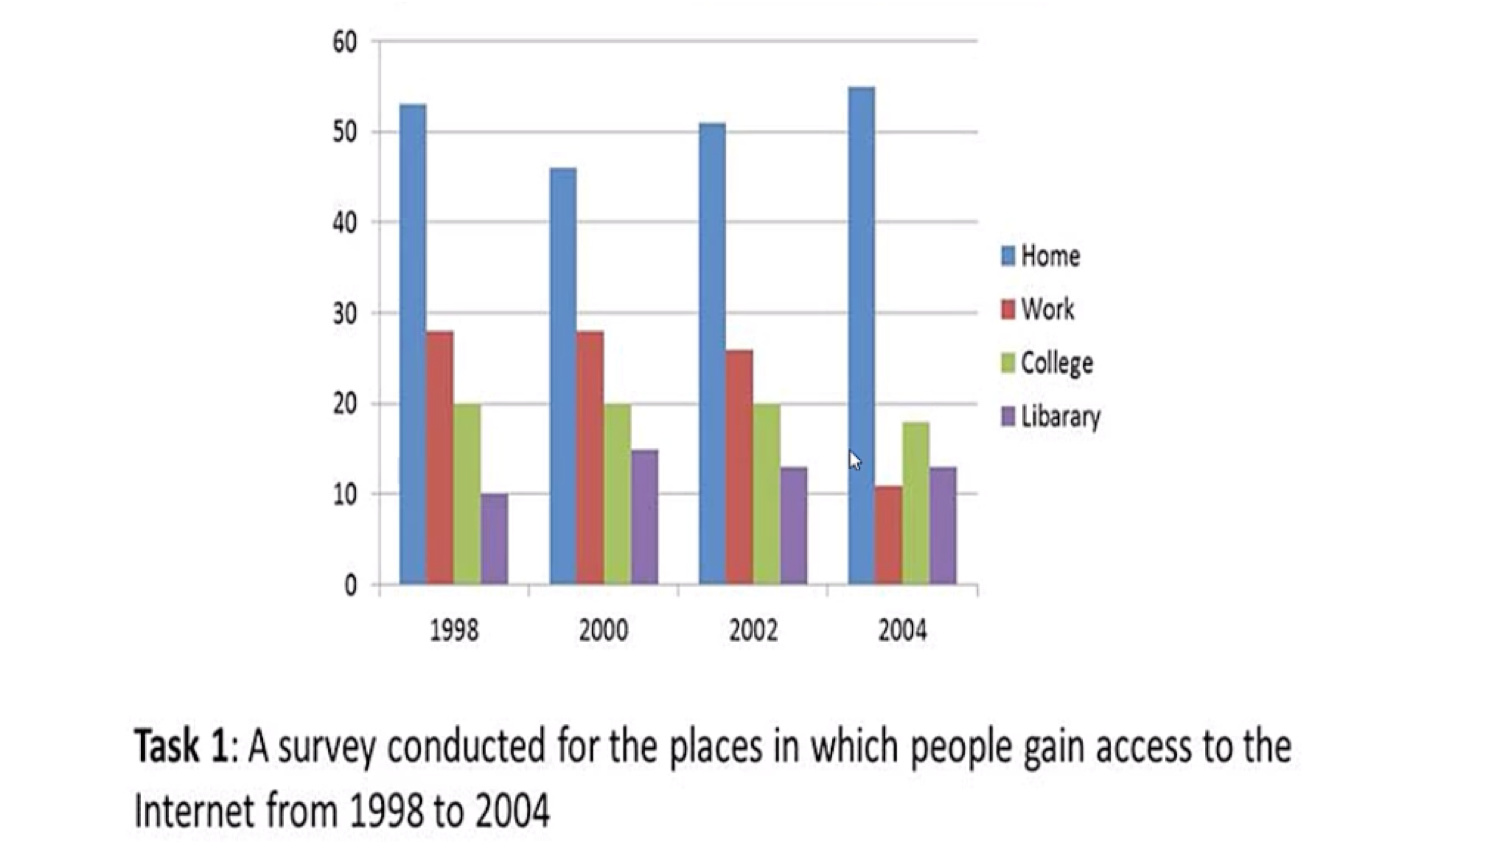
The bar chart illustrates data on the proportion of users connecting to the Internet in four different locations between 1998 and 2004. Overall, the percentage of people who accessed the Internet at home and in the library increased slightly, while the quantities of Internet users at work and college were dropped throughout this period.
At the begging of the period, in 1998, the proportion of users accessing the Internet from home was fairly high, at around 54%. By contrast, the rate for those using it at the library was low, exactly 10%. Besides, it was about 27% of users at work, compared to 20% of those connecting to the Internet at college.
As the graph shows, the proportion of people accessing the Internet from their houses was around 56% in 2004. On the other hand, the figures for access at work and college were exactly 10% and approximately 18% over the period. At the library, the percentage of people who used the Internet was grown about 5% from 1998 to 2000 and then decreased about 2% in 2002, where it remained throughout 2004.
Hi Kelvin, I thought this was clearer than your last report, though that might have been your friend’s report. What you have here sounds good, but you are missing a lot of what happens in the middle of the period. Except for library use, you have really only described the data in 1998 and the data in 2004. I would expect to read that access at home decreased from 1998 to 2000, but then recovered and ended the period at a high of 55% while the percentage of internet use at home stayed relatively steady until declining precipitously between 2002 and 2004. Try to point out some of the relevant features during the period, not just recite the starting and ending values. Here are some other suggestions: