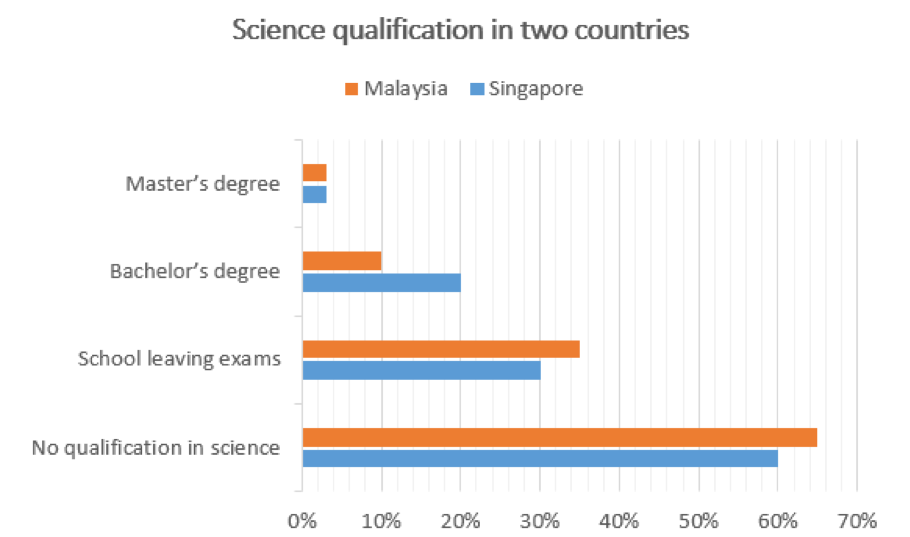
The given bar chart illustrates the percentages of people who hold science qualification in Malaysia and Singapore.
Overall, it is clear to see that there is a large number of people who do not hold qualification in science in both countries. By contrast, in three levels of education, both nations register shortages of people who hold science qualification .(Can I use: " science qualification shortage of people "??)
As for percentages of people who do not have any science qualification, in Malaysia this percentage is upper than 65% while in Singapore it is 5% lesser than that in Malaysia. As for master’s degree level, less than 5% of people hold science qualification in both Malaysia and Singapore.
Looking now at bachelor’s degree level, the percentages of people who hold science qualification are 10% and 20% respectively in Malaysia and in Singapore. Besides that, school leaving exams level witnesses a moderate quantity of people who hold science qualification in Malaysia account for about under 35% and in Singapore with 30%.
Hi, I think you have done a pretty good job with this report, especially considering I don’t think the chart itself is that great.
For instance, in Malaysia, 65% are unqualified, while 35% passed their school’s science exit exams. That right there is 100%, so what about the 10% with science Bachelor’s degrees and the 5% with Master’s degrees?
Are these also included in the 35% who passed their school exams?Unfortunately, I don’t think this analysis that I just did is what the IELTS graders expect or would appreciate, but to me the entire bar chart is either flawed or misleading. Sorry, had to “get on my soapbox” for a little bit there!
Here are some specific comments: