Please help me check this IELTS writing task 1- Bar Chart.
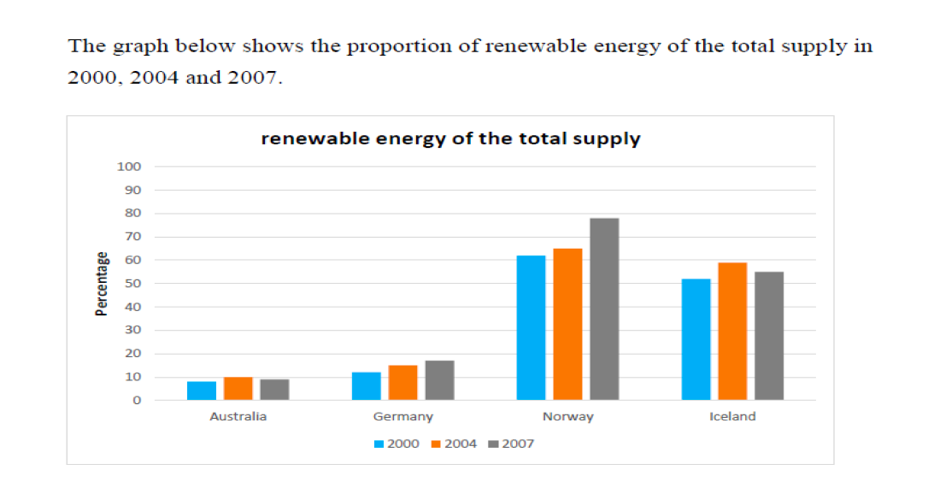
The graph illustrates the figure for the total quantity of energy recycling provided in Australia, Germany, Norway and Iceland in 2000, 2004 and 2007. While this percentage of Norway and Germany have a tendancy of constant rise in 2000, 2004 and 2007, the number of figure in Iceland and Australia slightly increased at the same period. Besides that, the total supply of Norway’s renewable energy witnessed the most highest point , Australia was seen as the most lowest by contrast. The proportion of suppliance transforming from energy resources was about 8 % in Australia and 52% in Iceland through 2000. Then, these 2 nations’s provision minimally increased to 10% and by 58% in 2004 before seeing a both decline of 9% and 55% in 2007. At the same time, the quantity of consumption of Germany and Norway saw a upward trend increasing by 18% from 11% in Germany and by 79% from 61 % in Norway throughout 3 years. That of continual rise also bring about the top of renewable energy of the total supply to Norway.
Thanks for your patience, I am finally back in Nashville. I thought you gave this a good try, but to be honest, it had a lot of problems. It is unclear if you know what renewable energy means.
That is probably not too bad, but by trying to use unsuitable synonyms, it just makes it very clear that you are unclear on the concept. Also, you always have to keep in mind that this is giving the proportion or percentage of renewable energy in relation to the total supply. So saying “the quantity goes up” is not really correct. For instance, imagine that the total supply went down - if the quantity of renewable energy stayed the same, then its percentage would actually rise. Also, your overall organization did not make that much sense to me. Looking at the graph, it is clear that Australia and Germany are somewhat similar, and Norway and Iceland are similar to each other, so I would organize the paragraphs like that. I guess your view is that both Germany and Norway experienced growth over the whole period. I don’t think that is quite as important, but if you want to divide it that way, make it more clear in your report why you chose to arrange your paragraphs the way you did. Here are some other suggestions: