Please help to correct my writing and give some feedback for my writing IELTS task 1. Thank you very much!
TASK:
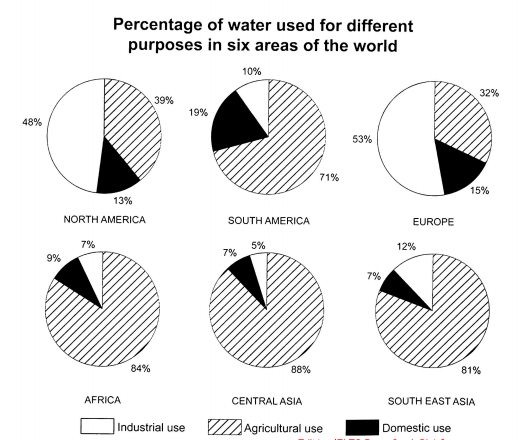
The pie charts below show the percentage of water used for different purposes in six areas of the world.
Summarise the information by selecting and reporting the main features, and make comparisons where relevant. Redirect Notice
The pie charts compare the proportions of water consumed for three different purposes in six regions across the globe. It is clear that a vast majority of water is utilised for agriculture in South America, Africa, Central Asia and South East Asia, whereas North Americans and Europeans use their largest amount of water for industrial purpose.
To begin with, more than 80% of the water in Africa, Central Asia and South East Asia goes to agricultural sector. Similarly, South Americans consume a large proportion of water for the same purpose, at 71%. While industrial water consumption in South East Asia accounts for 12% of total water usage, the figure for Central Asia is merely 5%. Interestingly enough, these two regions use the same percentage of water for domestic purpose (7%). In addition, more water is consumed for household function in South America than in Africa, which is 19% and 9% respectively.
With regard to North America and Europe, about half of water consumption is for industrial division. While North Americans use 39% of the water for agriculture, Europeans consume less amount of water for the same purpose, at 32%. For domestic sector, we can see that both regions utilise the smallest percentage of water.
Hi Duongan, I thought this report was excellent. You have effectively divided the graphs into two groups that show similarities. You have done a good job in showing how these two groups are similar and also how they vary. You have used excellent transition words to guide the reader through your well-developed paragraphs.
You have used a variety of words to avoid repetition, but a couple of your choices did not really sound natural. Still, I expect this report would score at a band 7 level as written. Here are some specific suggestions:
 Redirect Notice