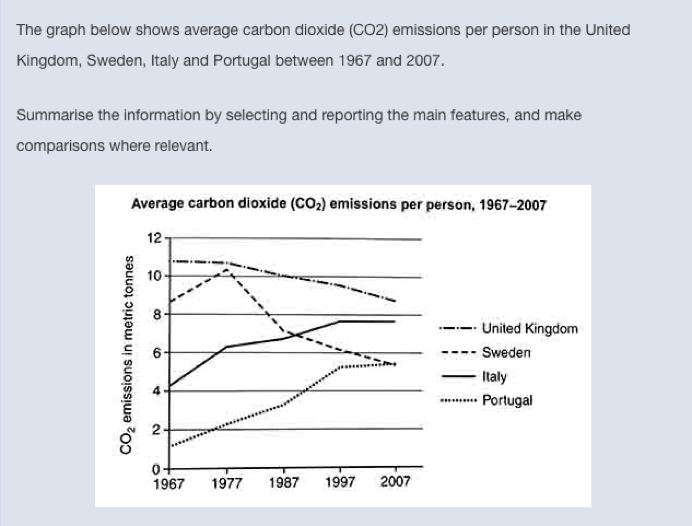
A glance at the graph provided reveals the average carbon dioxide(CO2) emissions per person in the United Kingdom, Sweden, Italy and Portugal from 1967 to 2007.The data is segmented in 10 years. The fluctuations of the CO2 emissions vary dramatically regarding to the four countries.
In United Kingdom, the amount of CO2 emissions dropped gradually during this period. Secondly, Sweden saw a marked increase of the emissions from 1967 to 1977, and continued to decline since then. Last but not least, Italy and Portugal have slowly growths of the gas emissions in the time interval.
Although United Kingdom experienced a remarkable decrease of the carbon dioxide emissions from 1967 to 2007, namely 3 tones per person, the country still had the highest emissions among the four countries in 2007. By contrast, Sweden was in the second place in 1967, however, the country became the last one of the average emissions in 2007, and has the same amount of Portugal. Moreover, Sweden had the most obvious change of the data shown in this figure. The amount of average CO2 emissions per person in Sweden declined from 9 tones in 1967 to 5 tones in 2007.