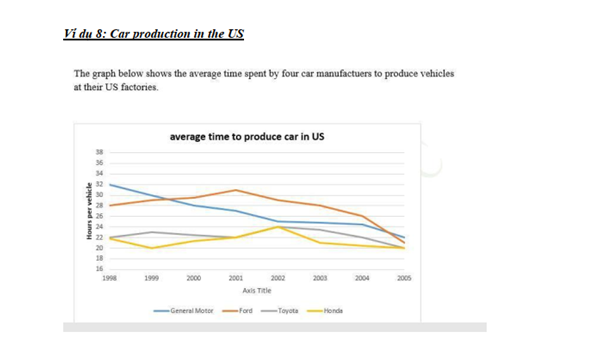
The line graph presents the common amount of time used to make vehicles by four car businesses in the US.
Overall, car companies spent lesser amount of time to make vehicles in the period, despite also having some fluctuation.
According to the graph, General Motor spent the highest amount of time to produce cars in 1998 as it was about 32 hours per vehicle; however, from 1998 to 2002 this statistics went down shiftly and temporary stopped at approximately 25 hours until 2004 when it continued it beginning trend and decreased sharply to 22 hours in 2005 but it still remained as the company with highest time spending on making vehicles. Ford’s statistics had a more fluctuated trend when they rocket from about 28 hours to 31 hours in 2001 but then fell down gradually to 21 hours in 2005.
Toyota and Honda both began at very low peak, around 22 hours but from 1998 to 2001, each company’s stats had its own tendency, particularly, Toyota rose up shortly while Honda fell down but they then both had an opposite trend and met in 2001. From 2001 to 2002, they spent the same amount of time and from 2002 to the end of the period, they both spent lesser time and ended the period at approximately 20 hours per vehicle.
The line graph shows the combined time spent on vehicle production by four US car companies.
Overall, the car companies spent less time making vehicles over the period, although there were some fluctuations.
According to the graph, General Motor spent the highest amount of time to produce vehicles in 1998, as it was around 32 hours per vehicle; however, from 1998 to 2002 this statistic decreased in shifts and temporarily stopped at around 25 hours until 2004, when it continued its initial trend and decreased sharply to 22 hours in 2005, but it still remained as the company with the highest amount of time spent to produce vehicles. Ford’s statistics showed a more fluctuating trend, rising from around 28 hours to 31 hours in 2001, but then gradually falling to 21 hours in 2005.
Toyota and Honda both started at a very low level, around 22 hours, but from 1998 to 2001 each company’s statistics had its own trend, in particular Toyota rose briefly while Honda fell, but then they both had an opposite trend and met in 2001. From 2001 to 2002 they spent the same amount of time and from 2002 to the end of the period they both spent less time, ending the period at around 20 hours per vehicle.