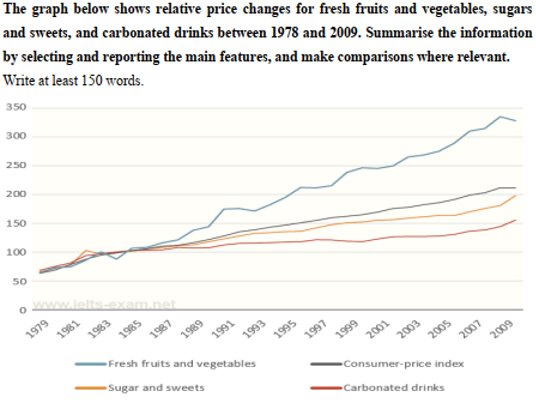
The line graph presents the changes for fresh fruits and vegetables, sugars and sweets, and carbonated drinks and compared them with the consumer-price index from 1978 to 2009. Overall all categories had their prices rised up and fresh fruits and vegetables seem to had increased it’s price most.
According to the graph, all categories started at the same point (54) but after 1987 the lines that show sugar and sweets and carbonated drinks seperated from others and become the two lowest. In particularly, price for carbonated drinks show a steady increased in the period and reach approximately 151 at the end of the period. The price for sugar and sweets rised sharplier and come to 200 peak in 2009 which it four time higher than it’s start.
In term of the consumer-price index it had a stably increased trend and show that consumer tend to spend more over time except in 2007 to 2009 period this category stopped rising and remained at approximatly 203 at the end of the period. The price of fresh fruits and vegetables although fluctuacted many times in the graph’s period, it turn out to had the highest price. In particularly, at first in 1979 it started at the same point as others and from 1981 to 1989 it flutuated a bit but after that, it’s price gradually increased to 2008 and then went down a little by 2009.
The line graph shows the changes for fresh fruits and vegetables, sugar and sweets, and carbonated beverages compared to the Consumer Price Index from 1978 to 2009. Overall, all categories have increased in price, and fresh fruits and vegetables appear to have increased in price the most.
According to the graph, all categories started at the same point (54), but after 1987, the lines showing sugar and sweets and carbonated drinks separated from others and became the two lowest. In particular, the price for carbonated drinks shows a steady increase in the period, reaching approximately 151 at the end of the period. The price for sugar and sweets increased more sharply and come to 200 peak in 2009 which it four time higher than it’s start.
In terms of consumer price index, it had a stable increasing trend and show that consumers tend to spend more over time except in 2007 to 2009 period this category stopped increasing and remained at approximately 203 at the end of the period. The price of fresh fruits and vegetables although fluctuaced many times in the graph’s period, it turn out to have the highest price. In particular, at first in 1979 it started at the same point as others and from 1981 to 1989 it flutuated a little but after that it’s price gradually increased until 2008 and then went down a little by 2009.