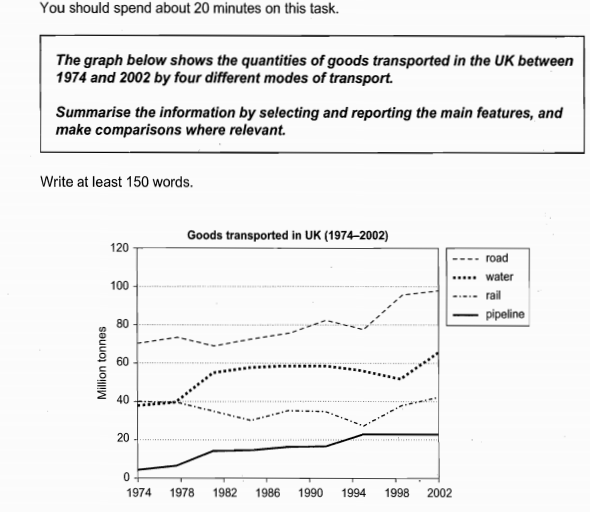
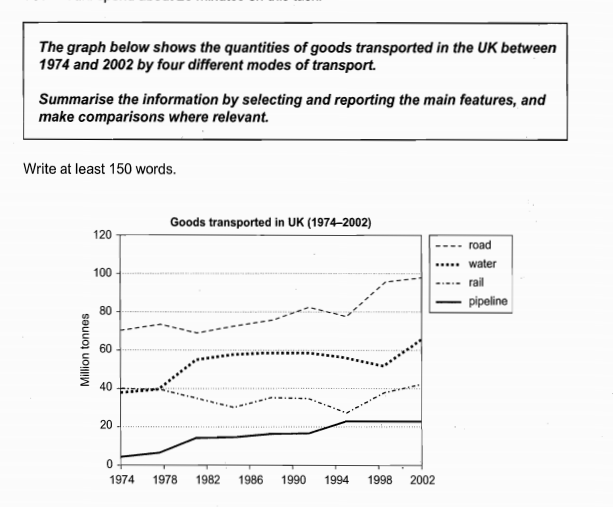
The line chart demonstrates how many tonnes of commodities transported in the British over the period 28 years starting from 1974 by 4 kinds of vehicles named the road, water, rail and pipeline, respectively.
It can be seen that the number of tones that carried by 4 modes of transport slightly fluctuated from 1974 to 2002. Road transportation led the first priority of the quantities in the delivery. Meanwhile, the figure for goods transported by pipeline always hit the lowest point when compared to 3 other means of transport.
Firstly, in the UK, the commodities delivered by road reached around 79 million tonnes, which is 30 million tonnes as much as the figures by railway. There was a considerate fluctuation in the amount of goods transported by road between 1978 and 1994, then the figure rosed up to nearly 100 million tonnes in 2002. the railway was used for delivering products remained the same popularity in 1974 and 20002
Secondly, the year 1974 witnessed the least number of goods transported by pipeline and water( it was around 5 million tonnes and 40 million tonnes, respectively). while the amount of commodity delivered by water peaked at nearly 60 million tonnes in 1982 and then continued to increase until 2002, the British less use the pipeline for transportation from 1974 to 2002.
Hi Ryana, I liked the fact that you gave a good summary of the overall data trends to begin with. Your paraphrase of the chart descriptoin had a few errors though.
I was able to understand your report, but it did take quite a lot of extra effort because many of your phrases were incorrect. There are still some sentences that do not seem accurate, like I can’t figure out when you mean road transport reached 79 million tonnes. Here are some other comments and suggestions: