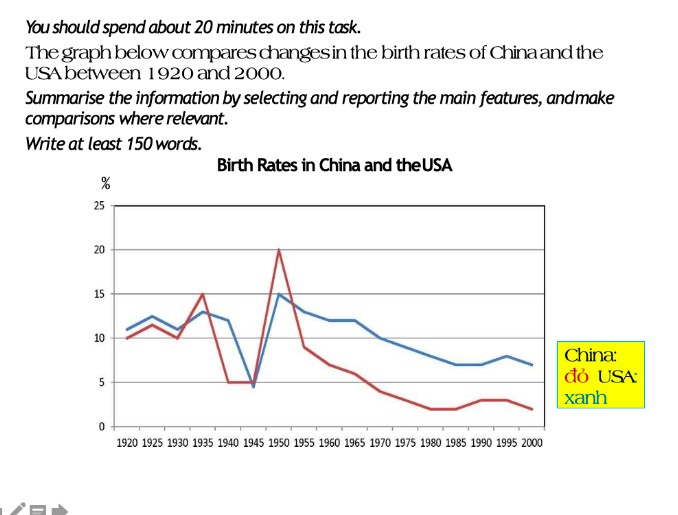
The line graph indicates changes in birth rates between the two countries namely China, USA from 1920 to 2000
In general, these were both downward trend of birth rates between 1920 anh 2000. Despite the similarity of the two figures. The birth rate of China wasn’t as high as the USA one.
In the 1920s the procreation rate of China still remained above 10 percent and fluctuated continously over a 20-year period Until 1935,after a decade , the rate went up to 15 percent. However, the figure dropped to 5 percent in 1940. The proportion of children giving birth still remained 5 percent during the 1940s. Nevertheless ,1950 witnessed a dramatic increase of 15 percent but in 1955 the rate fell to below 10 percent.From 1955 to 2000 ,the percentage of the children procreation saw a general and continual decline.
The birth rate of America in the 1920s is similar to the China one, there were both fluctuated uninterruptedly. there was a slight increase of the figure in the year 1935 , then it falls lightly in 1940 and decrease sharply to 5 percent in 1945.However, the USA rate went up significantly in 1950. Over the 50 -year period ,the number of children giving birth witnessed a gradual decrease.
Overall , both of the rates varied significantly between 1920 and 2000. They both decline gradually after 1950.
Hi, I think this report has the same problem as the other report I checked today, so I will copy that information here: Hi, I think the format of your report is good and what you have written is pretty clear, but it seems like you have left out the most important features of the graph. The first main point is the steep decline in the birth rate of both countries in the 1940’s, caused by World War II, followed by a post-war baby boom in both countries. The second main point is that after the 1950 peak, the birth rate in both countries decreased, but this decrease was much more pronounced in China and for the second half of the 20th century, the birthrate of China was less than half that of the US. I think it important to state these overall trends and comparisons to allow the reader to better envision the graph.
In addition, since this data is from the past, use past tense when describing it. Also be sure you understand the difference between children being born and children giving birth. The children do not give birth, the mothers give birth to the children.
Here are some other suggestions: