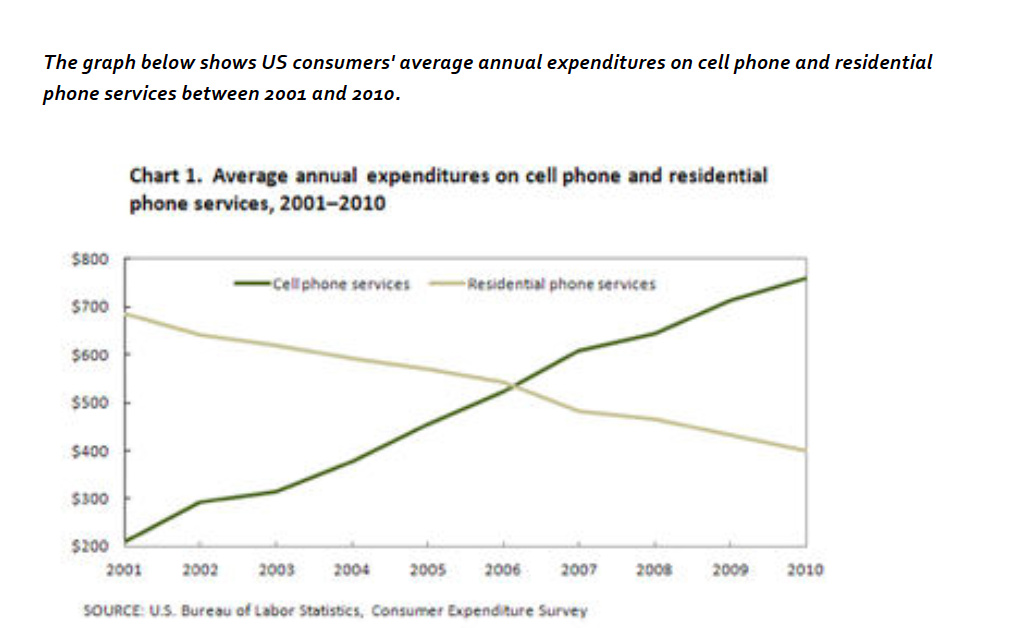
The given line graph compares mobiles and landing phone services in terms of average yearly spending.
Overall, it is clear that cell phone services are following an increasing patent and hold the first place, surpassed residential phone services in 2006. Landing phone services fell steadily over the 10-year period.
In 2001, US users spent an annual average of nearly $700 on residential phone services and declined steadily, compared to only around $200 on cell phone services which kept increasing over the years. At the end of 2001, while mobile phone consumers rose approximately $300, landing phone services had dropped by nearly $200.
In the year 2006, the average American paid out the same amount of money on both types of phone services, which is just over $500 on each. By 2010, expenditure on mobile phones had reached roughly $750, while the figure for spending on residential services had fallen to approximately $400.
Hi, I think your report was well organized and described the graph pretty well, but you did have some factual errors, or at least what sounded like errors. Plus, it was not always clear that you were talking about average per capita spending - sometimes you mentioned customers and sometimes it sounded like you were talking about the total spending.
Here are some specific suggestions: