Please help me to check this essay!
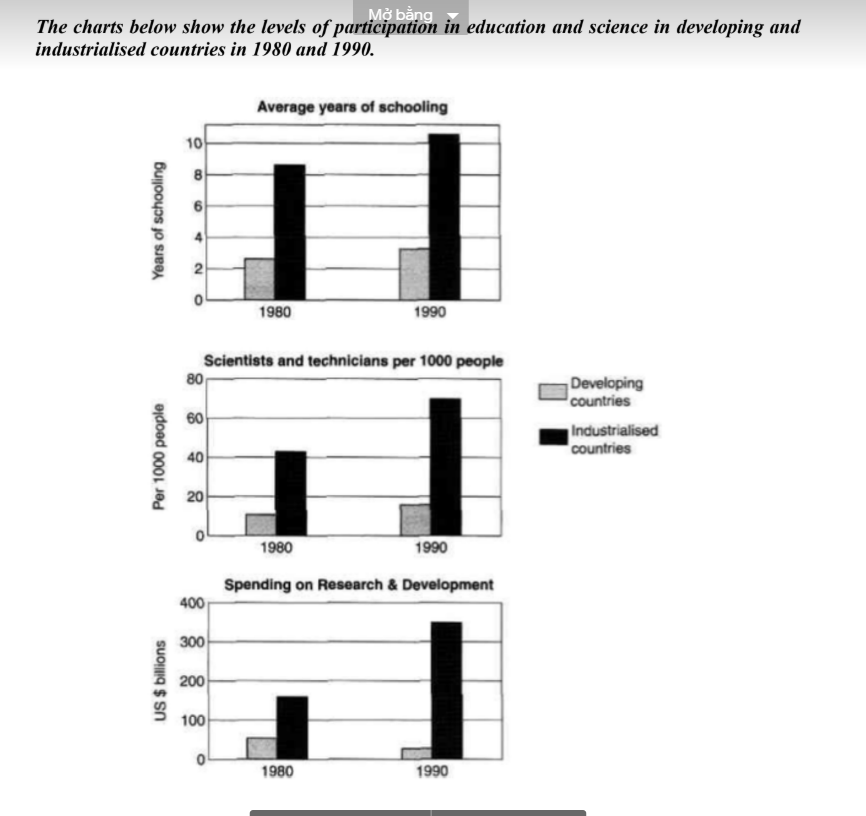
The charts compare the level of participation in schooling, sciencetists and technicians, and research and development between thhe developing countries and industrialised countries during the period of ten years, starting in 1980.
Overall, both the number of schooling years and people who were participating in science and technic in developing countries increased, with the exception of the amount of money spent on research and development. The figure of the three fields in industrialised countries all increased during the given period, and always higher than that in developing countries
It can be easily seen that in the first year of the period, both the data of average years of schooling, and sciencetists and technicians in industrialised countries four times higher than the figure in developing countries, just about more than 2 years schooling and 10000 sciencetists and technicians in developing countries. in 1990, all the figures higher, and the higher rate between two objects still remained.
in 1980, the amount of money spending on researchs and development in developing countries was only 50 bilion dollar, and it sharply fell to nearly 20 billion dollar in the last year of the period. opposite with developing countries, industrialised countries spent much on that, nearly 160 billion dollar in the first year and then increased almost two times, reached 330 billion dollar, which was nearly 17 times higher than the figure of developing countries.