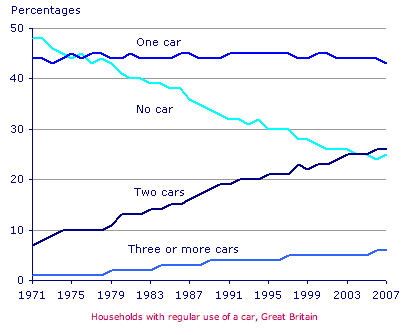
The graph compares the percentages of households owning different numbers of cars from 1971 to 2007 in Great Britain.
Generally speaking, the percentage of people who didn’t have cars declined in a rapid speed in the 36 years period. What’s more, it seemed like households tended to purchase more cars or increased their regular use of cars than they ever used to during the years.
To be more precisely, in1971, the majority of the public owned either one car or no car. However, since the population of not owning private vehicles dropped from 48% to 25% during the 36 years, those who possessed one car became the majority with a sustainable 45%.
In the other hand, among households with regular use of cars, those who possessed two cars rose most dramatically. The proportion increased from 7% to 27%, which slightly surpass that of no car in 2005 and became the second majority.