Please help me to check this IELTS writing task 1 essay!
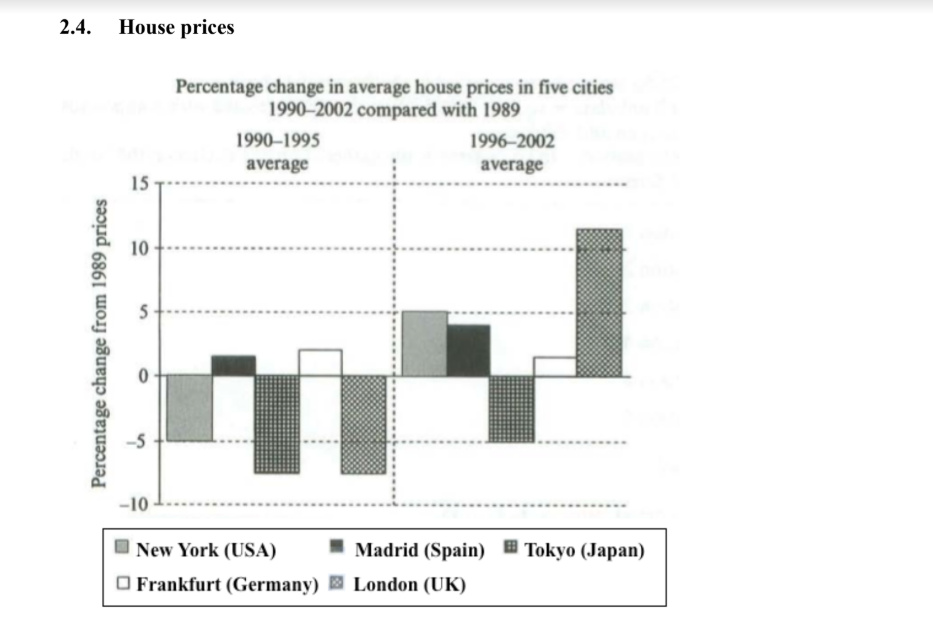
The given bar chart compares the cost of average house in five different cities, named as New York, Madrid, Tokyo, Frankfurt, and London over a period of 13 years, starting in 1989.
Generally, a decrease can be seen in the average house prices in most of cities between 1990 and 1995, but between 1996 and 2002, most of cities saw rising prices, especially a sharply increase in the change of average house prices in London.
In the first five years of the period, to compare with the house cost in 1989, Madrid house prices and Frankfurt house prices inceased 1% and 1,5% respectively, but all the three other cities house prices experienced a fall down by 5% in New York and 7% in Tokyo and London.
Between 1996 and 2002, prices jumped around 12% above the 1989 average in London. Homebuyers in New York also had to pay significantly more, with prices rising by 5% compared to the 1989 average house prices, but Tokyo house prices remained more cheaper than they were in 1989. The house cost in Madrid increase almost 2%, reached 4% higher than the figure in 1989, as a light decline can easily be seen in the cost of house in Frankfurt compared to those in the first five years of the period, but also higher than the 1989 average house prices