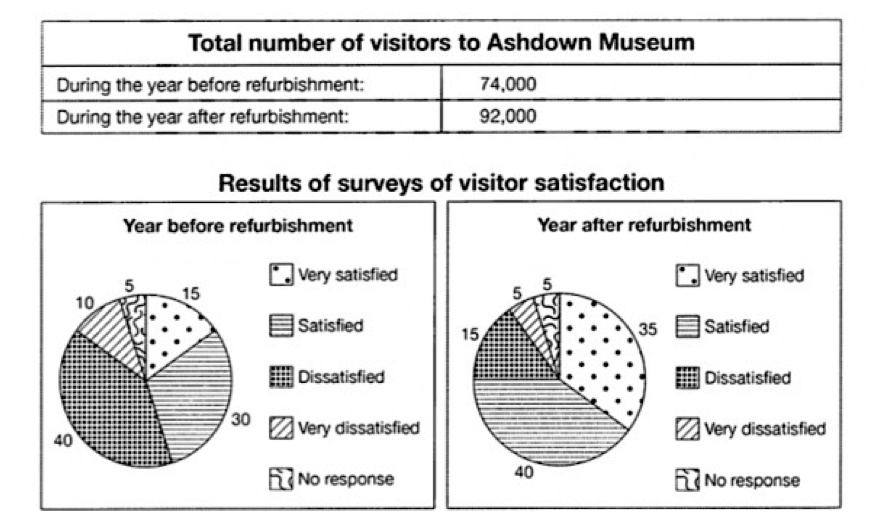
The table below shows the numbers of visitors to Ashdown Museum during the year before and the year after it was refurbished. The charts show the result of surveys asking visitors who satisfied they were with their visit, during the same two periods.
The table gives data about how many people visit to Ashdown Museum in 2 periods: before and after it is redecorated. The charts illustrate different categories of visitor’s satisfaction during the same time.

Overall, the table indicates the number of visitors coming to museum is much higher after its refurbishment. The charts show that the level of satisfaction of visitor increase sharply in the year after the museum is redecorated.

 The renew of Ashdown Museum attract many people coming to, with rising from 74.000 visitors to 92.000 visitors.

With regarding two charts, before the museum is modernized, the result is quite negative. Only 15% of visitors very satisfied about this place, whereas those who are dissatisfied accounted for 40%. After its refurbishment, the number of dissatisfied people decline sharply, just at 15%. In contrast, there was a dramatic increase in very satisfied visitors, rising to 35%. The percentage of people who do not response remain at the same figure 5% during 2 periods.